Viewing 2 posts - 1 through 2 (of 2 total)
-
AuthorPosts
-
September 7, 2016 at 8:48 am #966304
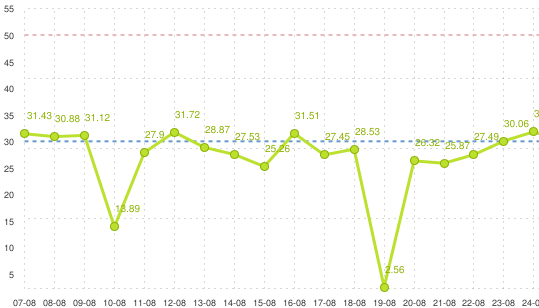
Hi. I need to know if JA Google Chart Module is able to show a minimum and maximum indicators lines, so people looking at the graph, can quicly see if the graph is inside minimum and maximum values. I ‘ve been testing the demo and reading the documentation, but I still not sure if it does what I need.
Similar to the example picture attached, see blue and red dotted lines.
Thanks in advance.
Saguaros Moderator
Saguaros
- Join date:
- September 2014
- Posts:
- 31405
- Downloads:
- 237
- Uploads:
- 471
- Thanks:
- 845
- Thanked:
- 5346 times in 4964 posts
AuthorPostsViewing 2 posts - 1 through 2 (of 2 total)This topic contains 1 reply, has 2 voices, and was last updated by
Saguaros 8 years, 4 months ago.
We moved to new unified forum. Please post all new support queries in our New Forum